
Orange County Charge Stacks for May 18-24: The Story Behind the Counts
A blog-first test of DUI concentration and charge-stack visuals from Orange County court filing data for May 18 through May 24, 2026.
DUI charge rows
60
DUI filing rows in the May 18-24 dashboard window, not arrest counts or convictions.
Officers with DUI rows
38
Distinct officers appearing on DUI charge filing rows in the same window.
Top 5 DUI share
30.0%
The five highest DUI-count officers accounted for 18 of 60 DUI charge rows.
Largest no-citation stack
39
Highest single-defendant officer encounter with no citation number and no infraction row in the support charges.
Source: Lotter Blotter MC #492 visual package generated from Neon public court-data tables and gold dashboard window bounds. This post uses aggregate public-record data only and does not state or imply that any person is guilty of an offense.
The Story Behind These Numbers
This week, the useful story was not simply that the dashboard found a large charge stack. The useful story was the split: some high-count encounters look like traffic or citation-driven events, while the largest stack in this window had no citation signal at all.
That does not prove how the case started. It does give us a cleaner question to ask: when one person shows dozens of charges, are we looking at traffic-stop spillover, or a different kind of investigation where each alleged item, act, transaction, or file becomes its own count?
DUI Was Broad, Not Dominated By One Officer
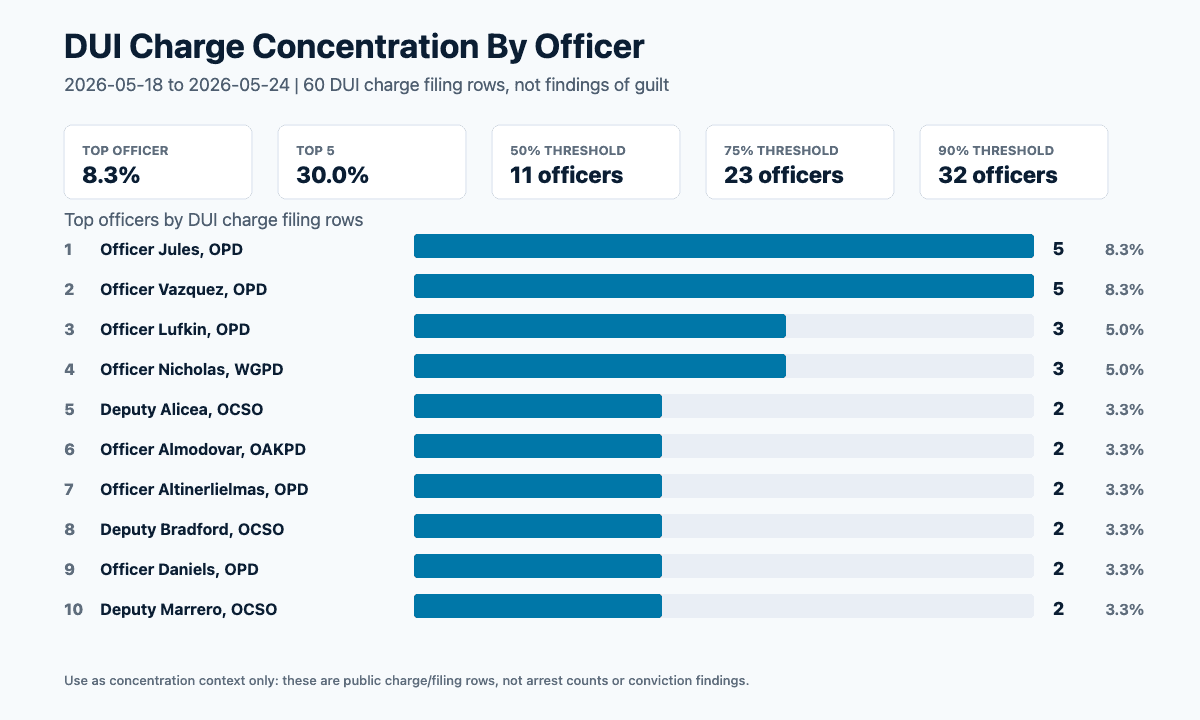
The dashboard captured 60 DUI charge filing rows for May 18 through May 24. Those rows were spread across 38 officers. The top officer accounted for 8.3% of the DUI rows, and the top five together accounted for 30.0%.
That is still concentrated enough to notice, but not concentrated enough to say one officer explains the week. It took 11 officers to reach half of the DUI filing rows, 23 officers to reach 75%, and 32 officers to reach 90%.
Charge Stacks Need A Split View
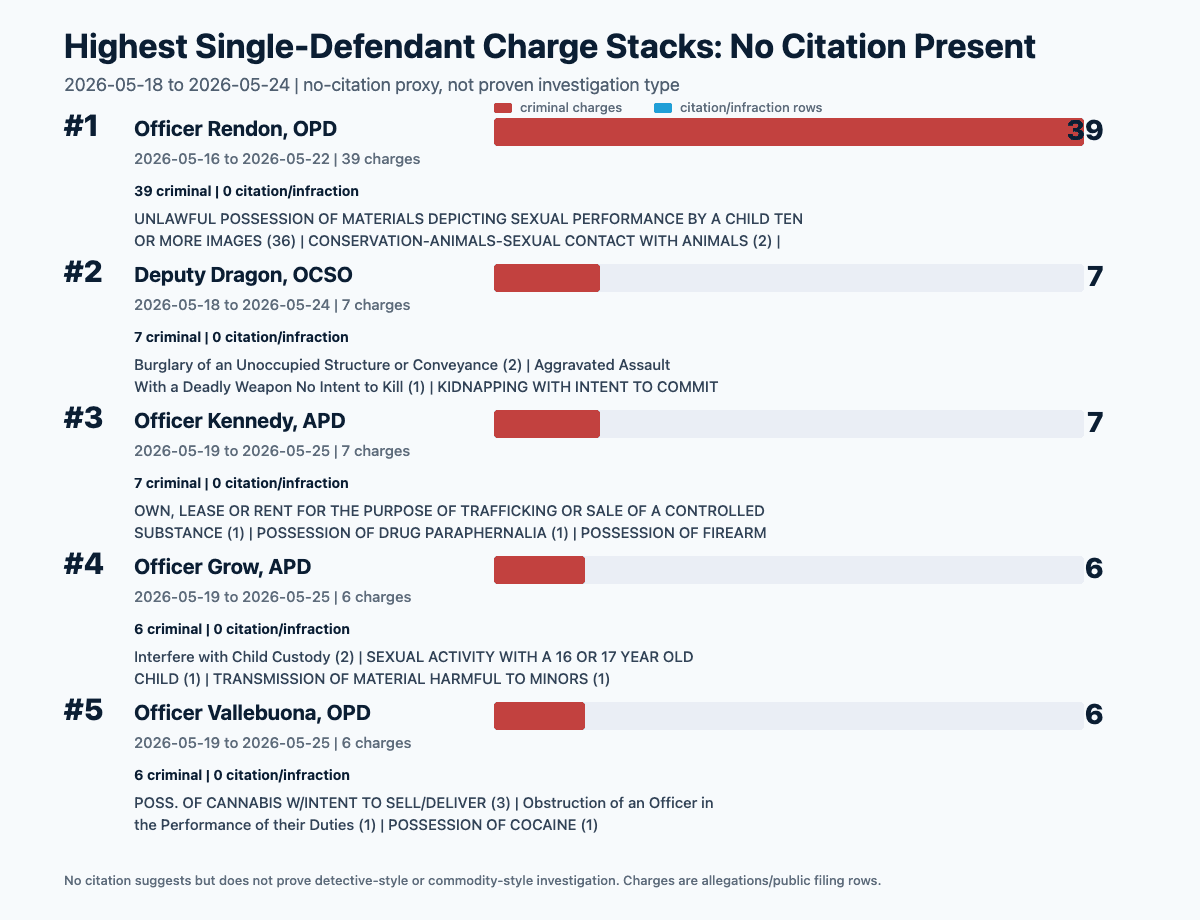
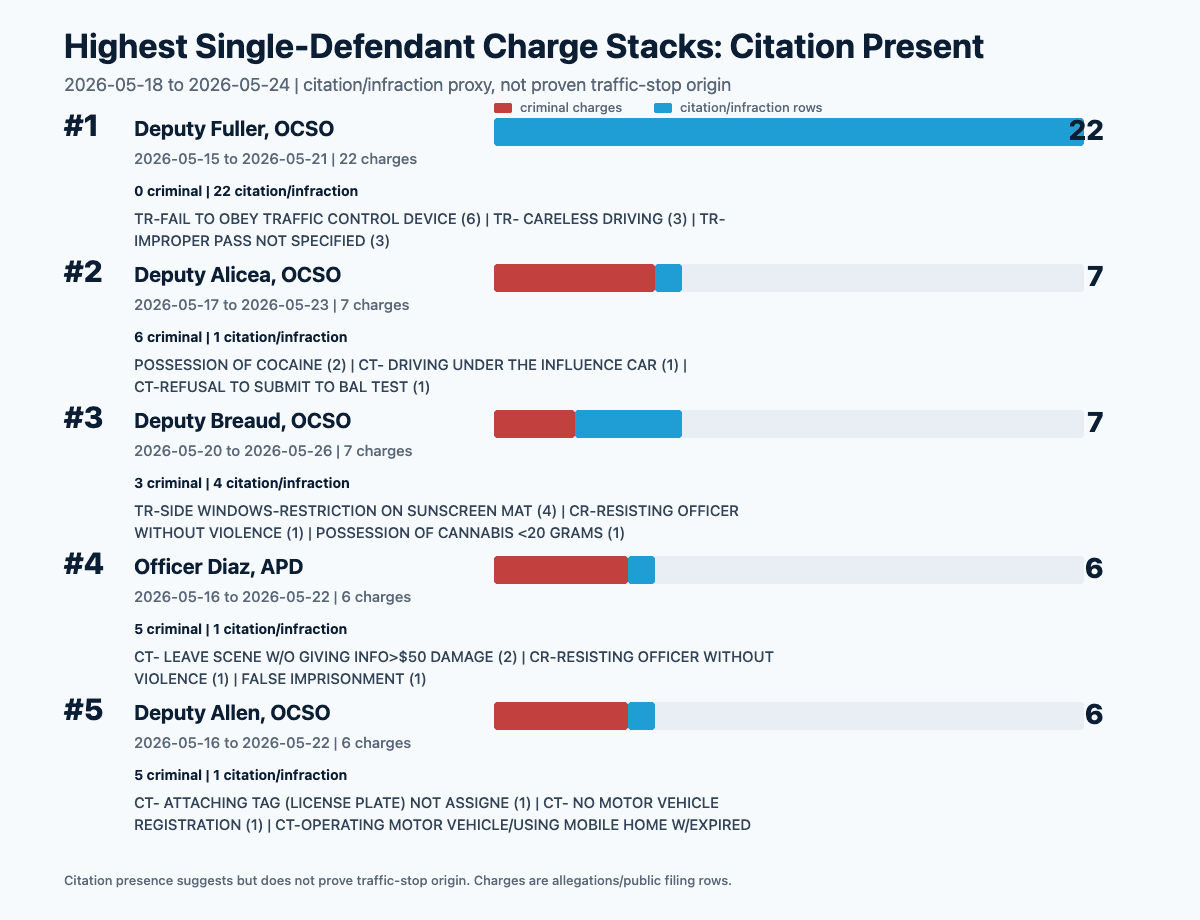
A single charge-stack chart can be misleading because not all stacks are the same kind of event. For this post, we split the same ranking logic into two visuals: no citation present, and citation present.
The no-citation side topped out at 39 charges. The citation-present side topped out at 22 charges. Both are large numbers, but they likely deserve different questions. A citation-present stack may be tied to a traffic event. A no-citation stack may be tied to a different kind of public-record investigation. Those are hypotheses, not conclusions.
What This Can And Cannot Prove
These visuals are based on public court filing rows. A charge is an allegation or filing event, not a finding of guilt. The charts do not prove impairment, officer conduct, traffic-stop origin, investigative origin, or the strength of any individual case.
The point of testing this in the blog first is simple: if the split helps people understand the data without overclaiming, it may earn a place in next week's dashboard. If it needs more context, the blog is the right place to find that out before it becomes permanent dashboard furniture.